Are you searching for an easy way to effectively track market moves and investment opportunities in the world of crypto? IntoTheBlock, an AI-powered tool that provides investors with actionable investment insights for the crypto market, is one great place to start.
One of the key features of IntoTheBlock is its Token Summary, which provides a concise view of some of the most relevant and actionable metrics for various crypto-assets. This summary also acts as a starting point for Crypto App Pro and Pro+ users to explore the service’s full range of analytics. Let’s take a closer look at some of the metrics in the Token Summary and why they are important:

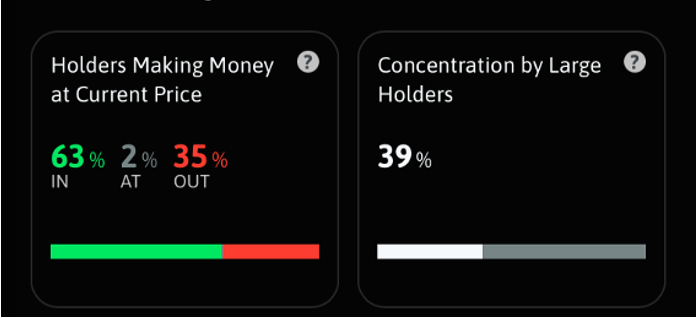
Holders Making Money at Current Price: This metric shows what percentage of addresses holding a crypto-asset are making profits, breaking even, and losing money at the current market price. It’s important because more addresses in the money is likely to be positive for the network as there is less selling pressure from holders trying to break-even on their positions.
Concentration by Large Holders: This indicator aggregates the percentage of circulating supply held by whales and investors. It’s helpful to estimate how decentralized or concentrated a crypto-asset is and, in general, it’s preferable for a crypto-asset to be held mostly by retail addresses instead of a large concentration of a few whales.
Price Correlation with Bitcoin: This metric shows the 30-day statistical correlation between the price of Bitcoin and a specific crypto-asset. It can give you insights into specific tokens that you may want to intentionally trade to track Bitcoin or use to diversify away from Bitcoin.
Holders’ Composition by Time Held: This indicator shows a crypto-asset’s ownership distribution by time held. It can give a view into the percentage of “diamond hands” holding an asset and if that percentage is growing over time, which would be a good thing.
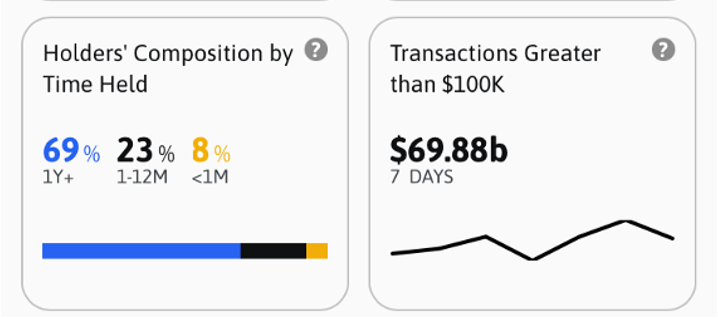
Transactions Greater than $100k: This metric shows the total volume transferred in transactions of over $100,000 USD as well as the number of transactions surpassing that amount over the past 7 days. Spikes in Large Transactions Volume point to high activity among whales or institutional players either buying or selling and could suggest an approaching bottom or top in the market cycle.
Telegram Members Change: This stat tracks the weekly change in the number of members in a crypto-asset’s official Telegram group. It can give insights into the growth of a community and also the community’s sentiment toward the asset.
Transaction Demographics: This indicator shows the percentage of transactions that take place on Eastern trading times in comparison to those on Western trading times over the past 14 days. It can shed insight into the asset’s regional popularity and potential daily trading pattern.
Total Exchanges Inflows and Outflows: This metric aggregates the total volume of a crypto-asset being deposited or withdrawn into top centralized exchanges over the past 7 days. These metrics can be helpful because spikes in inflows tend to coincide with or precede periods of high volatility whereas spikes in outflows usually follow either a crash or a significant break-out.
By leveraging these metrics and more, investors can gain valuable insights into the soundness and trajectory of a token.
Over the next few weeks we’ll be diving deeper into how to leverage these metrics and more, all powered by IntoTheBlock. All of these metrics are available for a wide selection of digital assets in The Crypto App’s Pro and Pro+ services, powered by IntoTheBlock. Access them with a 7-day free trial today.