Follow The Trend
Whether you are an active or passive investor, with or without experience, there is always a place and time for technical analysis. The problem is that techn ical analysis involves hundreds, if not thousands of indicators, and not all of them are universal.
Does that mean there is no alternative but to surround yourself with a mountain of books?
Not necessarily! One way to approach it is to stick to the basics, such as the analysis of support and resistance levels. By determining the highest and lowest points on the price chart, one can get an idea of the entry and exit points or more specifically – when to buy and sell stocks.
Let’s use the image below as an example.
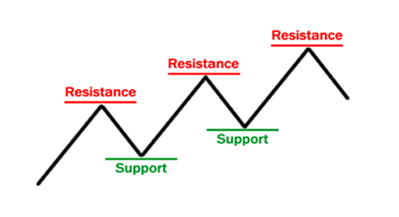
What we see is a bullish trend with a sequence of resistance and support levels. As you might have already guessed, the highest point reached before prices dropped is called the resistance. Meanwhile, the lowest point reached before the market begins moving upward again is the support.
To determine finer points of pricing, it is better to use candlestick charts. Candlestick charts provide added levels of detail, such as intraday movement, through visual indicators such as so-called ‘wicks’, or ‘shadows.’ The line chart, on the other hand, is simpler and provides a quick way to visualize a longer-term trend.
The next step would be to understand the strength of a level. To determine this, one question to ask would be – “How many times has a certain price level been tested in the past?” Once the trend around certain price levels is identified, stop-loss and take-profit orders could be placed.
But be careful, there is no guarantee you’ll get the price you want. If there is heightened volatility in the market, a broker could see itself forced to sell the shares below target. The best solution to this problem would be setting a limit price alongside the stop-loss order.
Finally, yet importantly, there is a thing called a “false breakout” or “failed break”, when the price briefly breaks through support or resistance indicating a continuation of a trend, but then bounces back and flies in the opposite direction due to the lack of momentum. Using multiple timeframes could help avoid falling into this trap.
Watch The Volume
The second key for the trader would be transaction history. By studying the market behavior over a specific period, using data like price, volatility, and volume, a trader could get a better picture of the asset in question.
In particular, the trade-order volume or the daily sum of the trade volumes divided by the sum of the order volumes on a percentage basis will show the level of liquidity of that particular asset. On top of that, a sudden increase in trading volume points to an increased probability of the price changing.
According to Charles Dow’s Theory, a surge in trades a day after a long advance could signal that the trend is about to change or that a reaction high may form soon. Put simply, strongly increased volume at a price going against the main trend could signal its end.
Don’t Ignore The Fundamentals
The financial markets tend to react to a wide range of macroeconomic events (CPI, PPI, PMI, rates decision, employment, etc.), crucial corporate news (earnings, profit warnings, the resignation of CEO, etc.) and geopolitical headlines (wars, conflicts, sanctions, etc.).
Most of these events will be covered by news platforms, but to save time, traders and investors around the globe start their day by checking the economic calendar.
Any surprise, whether pleasant or not, usually leads to an increase in volatility. Last week, for example, markets got nervous with the release of the minutes of the Fed’s March meeting and the Core Consumer Price Index on Wednesday.
Word of a possible recession has not only pushed stocks down but also the dollar index, aka DXY , below the 102 level. Treasuries and gold prices, in turn, surged all the way up. Without a doubt, it’s only going to get more interesting.
***
Advanced Charts by TradingView Available in The Crypto App’s Pro and Pro+
This guest post has been authored by TradingView, the world’s most popular charting platform for traders and investors. TradingView is the exclusive charting insights provider for The Crypto App’s Pro and Pro+, the ultimate toolkits for making powerfully informed trading and investing decisions in crypto. Click here to start your free 7-day trial to Pro or Pro+.