What is the difference between these charts and which one should you use for your technical analysis needs?
Observing price movements is the key to successful crypto trading. A single look at the chart can give you a better understanding of a trend or whether, let’s say, BTC USDT is a buy or sell now.
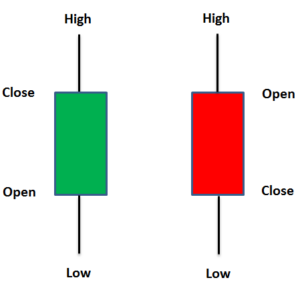
The Japanese candlestick chart is one of the most popular ways to observe price movements. Developed in the 18th century by legendary rice trader Munehisa Homma, candlestick charts revolutionized the way traders perceive market dynamics. These charts visualize price data through the use of candlestick patterns, depicting open, high, low, and closing prices for a given time period (e.g., day, hour, or minute).
The body of the candle is colored differently based on whether the closing price is higher or lower than the opening price. The wicks or shadows extend above and below the body, revealing the price range for that period. This means that one candlestick contains a lot of price information, which can make the analysis incredibly informative at a glance, but also a bit confusing or noisy at times.
This is where Heikin Ashi charts come in handy. Heikin Ashi charts also consist of candles, but their construction is based on modified calculations. The opening price of each Heikin Ashi candle is the average of the previous candle’s opening and closing prices. Similarly, the closing price is the average of the current candle’s open, high, low, and close.
This smoothing effect reduces market noise and provides a clearer view of the overall trend by showing an average price range rather than exact numbers. In fact, that’s exactly what “Heikin” means in Japanese – “average”.
For those investing for the long term or looking for stable trends, Heikin Ashi is an effective way to reduce the noise on the chart and see trends clearly. This is especially helpful when trading volatile instruments.
These inherent differences between candlestick charts and Heikin Ashi charts mean that different types of traders may end up gravitating toward one type of chart or the other to identify trends in different ways. Japanese candlestick charts are renowned for their ability to identify various candlestick patterns that indicate potential trend reversals, continuations, or indecision in the market. Traders analyze patterns common in these charts, like doji, hammer, engulfing, and many others, to make informed decisions.
In contrast, the modified calculations of Heikin Ashi charts place greater emphasis on the underlying trend rather than individual price fluctuations. The smoothed candles make it easier to spot longer-term trends, as the candle colors are determined by whether the average closing price is higher or lower than the average opening price. This allows for a more visually appealing and intuitive representation of the prevailing market sentiment.
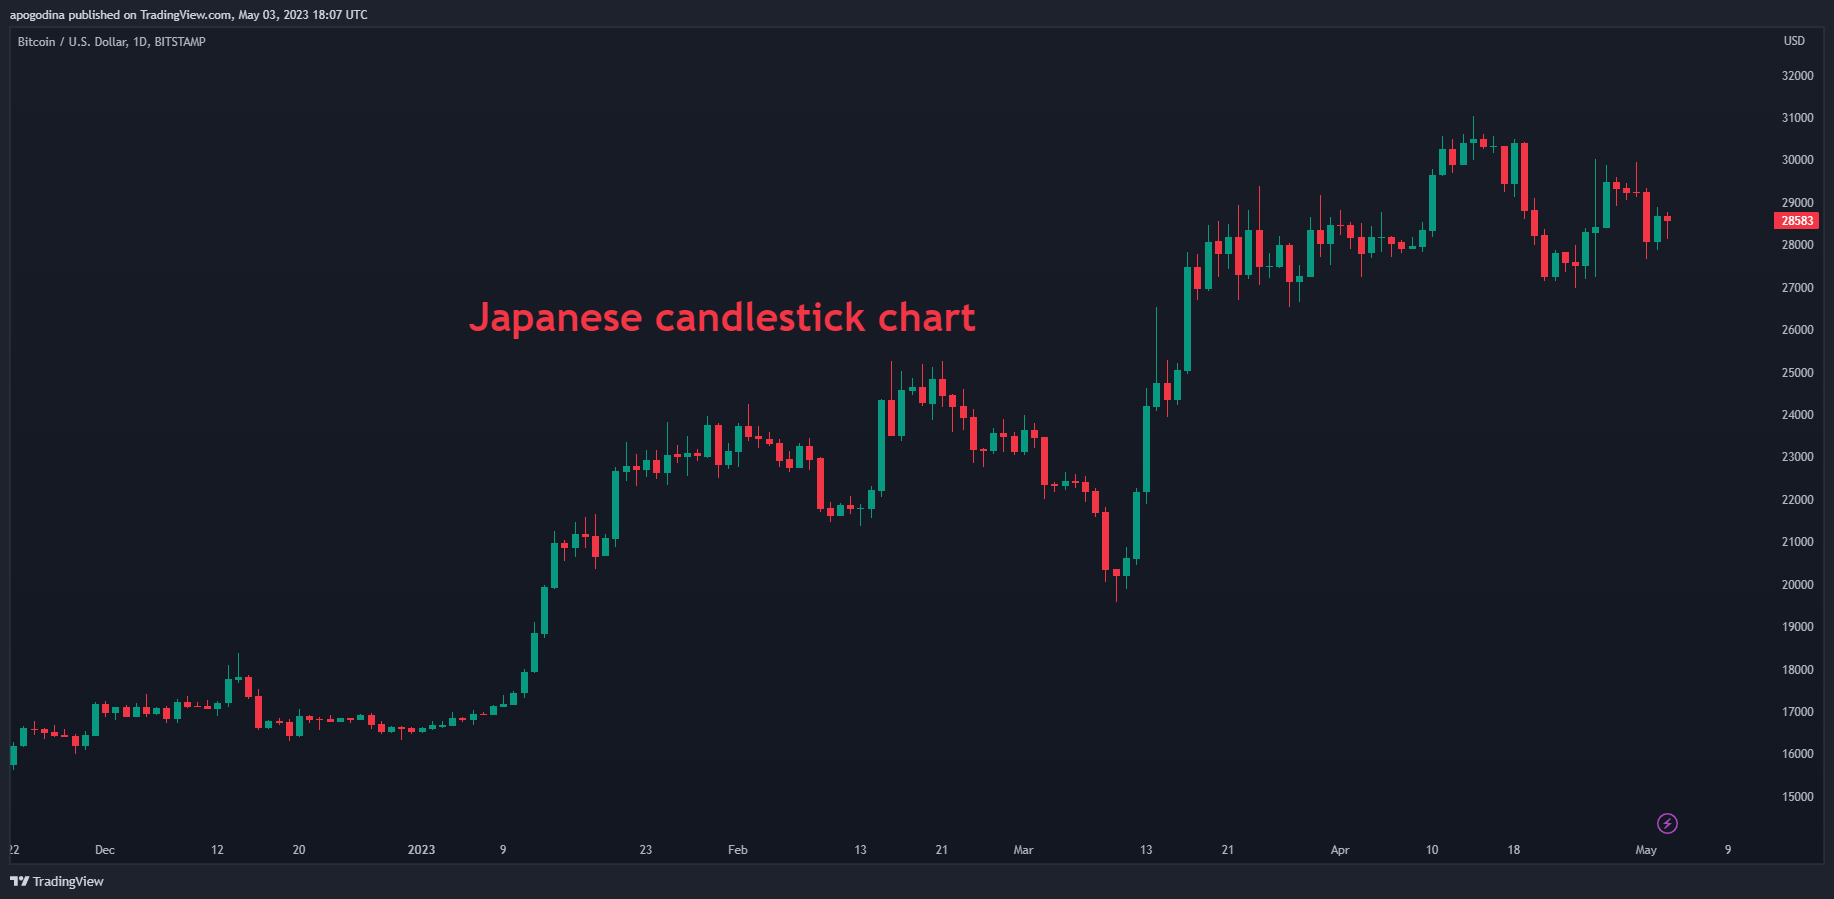
To understand Heikin Ashi charts, it is important to remember that each bar shows the average price range for a particular time period, while the Japanese candlestick chart shows the exact price levels for that period.
To better understand the contrast between candlestick charts and Heikin Ashi charts, let’s compare these two on a Bitcoin chart:
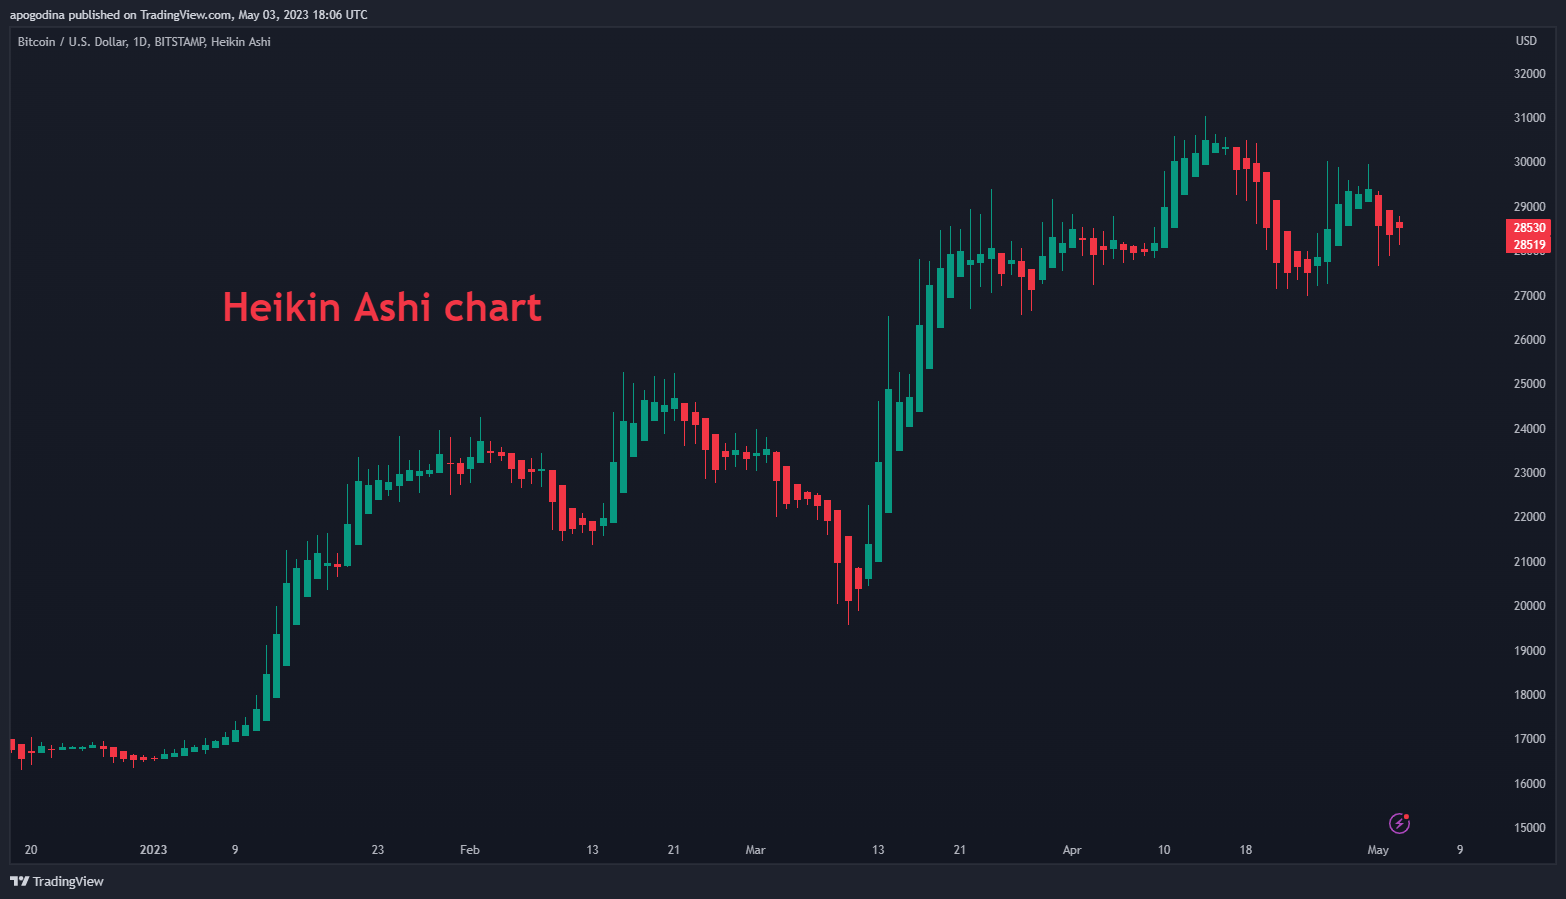
You probably noticed that candles on Heikin Ashi charts stay green during an uptrend and red during a downtrend. That is because this chart uses the OCHL formula, which stands for Open, Close, High, Low. The four components affect the shape, size and direction of the candles.
The best way to learn how to use these charts is to compare them, as in our example. Remember that the usage of these chart types also depends on your preferences. Do you want to spot every tiny detail of price movement, or just the average price? It is entirely up to you and TradingView tools that can be found in The Crypto App’s Pro and Pro+ offering gives you the opportunity to try out different options.
Note: although Heikin Ashi and other non-standard charts can be useful for market analysis, they should not be used for testing strategies or placing trade orders, as their prices are artificial and do not reflect the buy and sell levels of exchanges or brokers.